5.1 Daily Ice Analysis Charts
5.1.1 Description
These charts are of importance to icebreaker captains, commercial shipping interests and fishing vessels, to assist them in finding the easiest passage through the ice or to avoid the ice when feasible to do so. The charts are meant to provide ice information for strategic planning for their activities during the next 24 hours.
Please note that there are significant differences between daily ice analysis charts and observed/image analysis charts:
Daily ice analysis charts are done on a daily basis during the season, whereas image analysis charts are done when images arrive for a particular operational area. Observed charts are generated whenever ice conditions are encountered either from ships, helicopters or aircraft.
The other significant difference resides in the amount of detail on each chart. Observed and image analysis charts have more latitude regarding the amount of detail and information that can be placed on the product. Daily ice analysis charts will have less detail pertaining to ice areas and egg definitions. Consequently, daily ice analysis charts have a more generalized look compared to observed/ image analysis charts.
5.1.2 Method of Production
Daily ice analysis charts are computer-generated with the use of mapping and image analysis software. The system allows the forecaster to draw lines and place eggs, symbols, drift arrows, and ship positions.
The forecaster will use a variety of data sources such as NOAA AVHRR, GOES, ERS and particularly RADARSAT, as well as the image analysis charts from these data. The field observation charts from ships, helicopter and aircraft provide ground truthing (See Figure 5.16). However on days when no data is available, or when the image analysis does not coincide with the valid time of the daily ice analysis chart (1800 UTC), the ice model from CIS can be used to advance ice to the valid time.
The Egg Code
There are some limitations on the use of the egg code for daily analysis charts. Later in this chapter, we will specifically outline the significant differences. For a complete version of the egg code, please see Chapter 3.
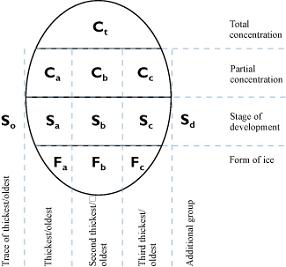
Figure 5.1: Elements of the Egg Code Used for Daily Ice Analysis Charts
|
| Note: The symbols Ca Cb Cc and Fa Fb Fc correspond to Sa Sb Sc respectively. |
Figure 5.2: Concentration(C)
| Total concentration (Ct) of ice in the area indicated in tenths and partial concentrations of thickest (Ca), second thickest (Cb) and third thickest (Cc). Note that Cd which appears on observation/SAR image analysis charts, will not be indicated on daily ice analysis charts from the Canadian Ice Service. |  |
Notes:
Figure 5.3: Stage of Development (S)
| Stage of development of thickest (So), second thickest (Sa), third thickest (Sb) and fourth thickest (Sc) ice and the thinner ice type Sd, of which the concentrations are reported by Ca Cb Cc respectively. |  |
Notes:
So - stage of ice development thicker than Sa, but having a concentration less than 1/10 (see Example 4).
Sd - stage of development of the thickest remaining ice types. It is the fourth stage present after Sa, Sb and Sc. Partial concentration must be at least 1/10 (see Example 4), except during the freeze-up period when a trace of new ice may be present (see Example 2).
Se - this stage of development will not appear on a daily ice analysis chart.
Table 5.1: Coding for Sea-Ice Stages of Development (So Sa Sb Sc Sd)
| Description | Thickness | Code |
|---|---|---|
| New ice | < 10 cm | 1 |
| Grey ice | 10 -15 cm | 4 |
| Grey-white ice | 15- 30 cm | 5 |
| First Year ice | > 30 cm | 6 |
| Thin first-year ice | 30- 70 cm | 7 |
| Medium first-year ice | 70- 120 cm | 1· |
| Thick first-year ice | > 120 cm | 4· |
| Old ice | 7· | |
| Second-year ice | 8· | |
| Multi-year ice | 9· | |
| Ice of land origin | ||
| Brash | - |
Table 5.2: Coding for Lake Ice Stages of Development (SoSaSbScSd)
| Description | Thickness | Code |
|---|---|---|
| New lake ice | < 5 cm | 1 |
| Thin lake ice | 5 -15 cm | 4 |
| Medium lake ice | 15- 30 cm | 5 |
| Thick lake ice | 30- 70 cm | 7 |
| Very thick lake ice | 30- 70 cm | 1· |
Notes:
Figure 5.4: Form of Ice (F)
 |
Table 5.3: Coding for Form of Ice (FaFbFc)
| Description | Width | Code |
|---|---|---|
| Small ice cake, brash ice | < 2 m | 1 |
| Ice cake | 2 - 20 m | 2 |
| Small floe | 20-100 m | 3 |
| Medium floe | 100-500 m | 4 |
| Big floe | 500-2000 m | 5 |
| Vast floe | 2 -10 km | 6 |
| Giant floe | > 10 km | 7 |
| Fast ice | 8 | |
| Icebergs | 9 | |
| No form | X |
Notes for Table 5.3:
Coding and Symbology for Strips and Patches
![]() C
C
The symbol ![]() , placed at the bottom of the egg in Form of Ice section, indicates that the ice is in
strips and patches and that the concentration within the strips and patches is represented by C
(see Example 8).
, placed at the bottom of the egg in Form of Ice section, indicates that the ice is in
strips and patches and that the concentration within the strips and patches is represented by C
(see Example 8).
In an area in which the ice is arranged in strips and patches and the ice floes are medium (code 4)
or greater, the floe size shall be indicated by using two eggs. The floe sizes are indicated as normal
in the first egg with the ![]() symbol placed between the first and second eggs.
The
symbol placed between the first and second eggs.
The ![]() symbol is repeated
in the second egg beside the total concentration of the strips and patches (see Example 9).
symbol is repeated
in the second egg beside the total concentration of the strips and patches (see Example 9).
In an area of ice in which some first-year or thicker ice type(s) is/are embedded as strips and
patches, the strips and patches shall be indicated by the use of two eggs. The overall partial
concentrations of the ice types are indicated in the first egg and the concentration within the
strips and patches are indicated in the second egg. The ![]() symbol shall be placed between the two
eggs and along with the total concentration in the second egg (see Example 10). Double eggs will be
indicted with a leader line to the polygon in question.
symbol shall be placed between the two
eggs and along with the total concentration in the second egg (see Example 10). Double eggs will be
indicted with a leader line to the polygon in question.
Where there are isolated strips and patches of ice, of less than 1/10 concentration, located outside
the main ice areas, the strip (![]() ) symbol will be placed in the area of these strips. Usually these
symbols are used to indicate ice in the final stage of melt.
) symbol will be placed in the area of these strips. Usually these
symbols are used to indicate ice in the final stage of melt.
5.1.2.1 Defining Polygons
The parsing of ice areas can be done in one of two ways:
1) By various ice types;
2) By concentration.
Note that only solid lines will be used to separate areas of different ice type/concentration (no dash lines).
1)Ice Type
Mandatory boundaries are required between new, grey, grey-white, first-year and old ice.
Please note that ice codes 2 (nilas ice, ice rind), 3 (young ice), 8 (first stage thin first-year ice) and 9 (second stage thin first-year ice) and X (undetermined or unknown) will not appear on any daily ice analysis charts from CIS.
For old ice, (7·, 8· and 9·) boundaries are required between areas with concentrations of:
When two ice types are present in equal concentration, the older/thicker type is considered predominant.
When three or more types are present in equal concentrations, the second oldest is considered predominant.
2) Total Concentration
In the case of total concentration, mandatory boundaries, shown as solid lines are required between areas of:
The total concentration is the first determining factor in defining ice boundaries. Partial concentrations of new ice are ignored when first-year or thicker ice is present.
5.1.2.2 Floe Size
Mandatory boundaries must also be placed between areas of predominantly medium floes or larger (code 4) and areas of predominantly small floes or smaller (code 3) when 6 tenths of thin first-year or thicker/older ice are present.
5.1.2.3 Discretionary boundary
In addition to the guidelines for mandatory boundaries, discretionary boundaries can also be used when sufficient data or knowledge of the ice regime has been verified by up-to-date reconnaissance flight, reports or satellite information. These boundaries are to be maintained on subsequent charts only if there is sufficient knowledge of the location, as provided by these data sources.
Discretionary boundaries should only be used in operationally sensitive areas, namely:
Ice type to consider:
When considering the use of a discretionary boundary, only first-year and old ice are considered, provided there is sufficient knowledge to supply this additional detail. The exception would be in the Great Lakes, where thick or very thick lake ice and areas of ridging should be considered for discretionary boundaries.
Ice Concentration of ice to consider:
Total ice concentration must be at least "close pack" (7 or 8 tenths of ice). New ice, as usual, is ignored when evaluating the total concentration.
Variance of the concentration to consider:
A discretionary boundary may be used if the partial concentration of the first-year or thicker (thick or very thick lake ice) ice varies by at least 3 tenths in a definable area within a mandatory polygon (see Examples 13 and 14).
5.1.2.4 Valid Time
Normally every daily analysis chart generated at the Canadian Ice Service has a valid time of 1800 UTC. The chart thus represents ice conditions at 1800 UTC.
5.1.2.5 Corrections and Amendments
When a correction or amendment is made to the chart, the abbreviation COR or AMD will appear next to "Ice analysis/Analyse des glaces" at the top of the legend.
For an example of a corrected/amended chart, please see Figure 5.10, page 5-19.
5.1.2.6 Chart Legend
Used on daily ice analysis charts to detail the region, valid time and date, and other ancillary data. In the legend of the chart itself, other ancillary data can be indicated such as reconnaissance flight, RADARSAT or NOAA imagery. At the bottom of the legend, other types of information can be indicated such as the latest chart received from a particular coast guard ship. With regards to RADARSAT and NOAA, the usual information indicated for these fields would include the date. On the line just below these sensors would have the time of the image used as well as a description of the area the imagery covered. Note that for NOAA, clouds can hide ice information therefore, the portion of the image which was used for the daily ice analysis will be indicated by using terms such as: south of 5600N/West of 7500W, etc. Sometimes, the entire area will be cloud covered. In these cases, it will be indicated as: Cloudy/Too Cloudy or terms to this effect. |
 |
5.1.2.7 Deadlines
Deadlines may vary from chart to chart, and from season to season.
As a general rule, at least one chart should be made ready for transmission from CIS at 1600 Eastern Standard Time (or Daylight Saving Time). However, in consultation with the CCG Ice Operations Centre(s), priorities regarding which chart to send out first will be determined on a daily basis, to ensure that the most operationally sensitive chart is first selected for transmission.
For information received from outside sources (CFR charts, CCG ship reports, etc.), a minimum of 2.5 hours before the transmission deadline is required to integrate it into the daily ice analysis chart. In most cases when the information arrives late, the forecaster will endeavour to integrate the information, especially if it is operationally sensitive. However, this may cause a delay in the delivery of the chart. The decision to process the information or not, for use in the chart, will be at the discretion of the forecaster in consultation with CCG ice operations office.
5.1.3 Dissemination of Charts
Upon completion of the analyses, daily ice analysis ice charts are disseminated electronically via a product delivery system. Clients will receive products via e-mail, fax or the internet. ISS and CCG clients have a special customised delivery system set up.
5.1.4 Symbols Used on Daily Ice Analysis Charts
Symbols for Dynamic Process
| Drift |  |
Indicates the direction and drift speed (in nautical miles per day) in the general area for the next 24 hours from the valid time of the daily ice analysis chart |
Symbols for Defining Limits
| Analysed edge or boundary | |
| Bergy water boundary |
| Ship reports | Used to indicate the latest position and time of a Coast Guard ship. | |
| Bergy water | Symbol used to indicate bergy water conditions. | |
| Ice-free | Symbol used to indicate ice-free conditions. | |
| Ice island or Ice island fragment | Symbol used to indicate ice island or fragments | |
| Open water | Stipple pattern used to indicate open water areas. | |
| Fast ice | Black or grey area representing fast ice. | |
| Strips and patches | Symbol used to indicate strips and patches of ice outside the ice edge. |
5.1.5 Colour Coding Ice Charts
CIS Colour Code
Colours are used to enhance ice charts for presentations and briefings. They also allow users to make a quick assessment of general ice conditions. The colour code available to CIS clients represents the severity of the ice conditions, and is somewhat similar to a traffic light:
Figure 5.6: Standard CIS Colour Code
Ice coverage in tenths
| Ice thicker than 15 cm | Predominant Ice -15 cm or less | ||||
| Open or bergy water | LIGHT BLUE | Less than 10 cm (new ice) | BLUE | ||
| 1 to 3/10 | GREEN | 10 to 15 cm (grey ice) | RED | ||
| 4 to 6/10 | YELLOW | Old Ice | |||
| 7 to 8/10 | ORANGE | 1 to 4/10 | PURPLE LINES | ||
| 9 to 10/10 | RED | 5 to 10/10 | PURPLE | ||
| Fast ice BLACK, GREY | |||||
Internal Colour Code and Hatching Scheme for Quality Assurance
There is also an internal colour code and hatching scheme used at the CIS to verify the quality and consistency of the chart. These specific hatching and shading patterns help to identify problem areas, such as incorrect ice types in a polygon (colour) or incorrect concentrations (hatching).
Please note that the internal colour code and hatching scheme is not used for publication purposes.
The Canadian Ice Service QA colour code uses patterns and colour to depict ice conditions on Daily and Regional Ice Charts. This code allows forecasters/analysts to visually follow trends in ice growth and to ensure that ice chart products are consistent with the climatological regime of the region. It is loosely based on the W.M.O. code and describes the ice conditions in a given polygon based on total ice concentration and stage of development. Colour is used to identify different stages of ice development from new to old ice. Patterns are used to identify ice concentration from a trace to consolidated ice.
Figure 5.7 Canadian Ice Service QA Colour Code for Ice Charts
 |
Concentration(Pattern)
Decide on the primary pattern by determining total concentration.One exception is in the case of an ice polygon which has new ice and ice thicker than first year. In this case the partial concentration of the new ice is disregarded when calculating the total amount of ice.
Exemples:
| 9+/64/71/5x | the total concentration is 6 10ths therefore the primary pattern is |
|
| 8/116/7.51/34x | the total concentration is 2/10ths | |
| 9+/73/75/44 | the total concentration is 9+/10ths |
Decide on the second thickest ice type in the polygon and select the appropriate secondary hatching pattern that corresponds to its partial concentration.
Exemple:
| 8/53/7.4./55 | the total concentration is 8/10ths the partial concentration of the second most predominant ice is 3/10ths therefore the polygon would be hatched as: |
Ice Type (colour)
The colour of the primary hatching is determined by the predominant ice type. The colour of the secondary hatching corresponds to the next thickest ice type in the polygon.
When 2 ice types are present in equal concentrations the older/thicker ice type is considered predominant.
When 3 ice types are present in equal concentrations the second oldest is considered predominant
When old ice is present with a concentration of 4/10ths or more it will be considered predominant.
These are the corresponding ice type / colour match ups. Note: the coloured output on some printers may vary slightly.
| New | Grey | Grey-white | First-year | Old |
| Open water (less than 1/10 sea ice, no ice of land origin) | ||||
| Bergy water (less than 1/10 sea ice may be present and total ice concentration is less than 1/10) | ||||
| Ice free (no ice present) | ||||